1. Configuration Parameters
Test setup configured using long PUCCH sequence allocation with intra-slot frequency hopping and time-domain OCC spreading.
| Parameter | 3GPP Symbol | Value / Setting | Description |
|---|---|---|---|
| Channel / Format | — | PUCCH Format 1 | Sequence-based long format (≤ 2 bits) with TD-OCC |
| Resource Type | — | COMMON_NON_DEDICATED | Common resource set for initial access / random access |
| Resource Set Index | r_PUCCH | 7 | Resource set entry selector |
| Allocated RBs | N_PRB | 1 PRB (M_sc = 12) | Single physical resource block transmission |
| Initial Cyclic Shift Index | m_0 | 1 | Base initial cyclic shift index |
| Group Hopping | pucch-GroupHopping | Group Hopping Enabled | Dynamic group index switching (Hop 0: u=10, Hop 1: u=7) |
| Frequency Hopping | intraSlotFrequencyHopping | Enabled (ISFH_ENABLE) | Intra-slot frequency hopping across 2 hops |
| Orthogonal Cover Code Index | i_OC | 1 | Time-domain orthogonal cover code index |
| Modulation Scheme | — | QPSK | QPSK modulation mapping for UCI payload |
| Cell ID | N_ID | 100 | Drives PRN seed c_init = 100 and base sequence group u = 10 |
| Slot Number | n_s,f^μ | 1 | Slot index within radio frame |
2. Expected Intermediate Values & Symbol Multiplexing
Derivation of pilot vs data symbol allocations and group hopping indices evaluated across the 10-symbol slot allocation for Cell ID 100.
PRN Initialization Seed:
Total Allocated Symbols:
Data (UCI) Symbol Indices:
Pilot (DM-RS) Symbol Indices:
c_init = N_ID = 100Total Allocated Symbols:
N_symb = 10 | Allocated Grid Size: 12 x 10 = 120 elementsData (UCI) Symbol Indices:
{1, 3, 6, 8} (4 elements)Pilot (DM-RS) Symbol Indices:
{0, 2, 4, 5, 7, 9} (6 elements)
| Hop Index | OFDM Symbol Range | Sequence Group Index (u) | Sequence Base Length | Hopping Status |
|---|---|---|---|---|
| Hop 0 | Symbols 0 – 4 | u = 10 (100 mod 30) | M_sc = 12 (v = 0) | PRB Index 0 |
| Hop 1 | Symbols 5 – 9 | u = 7 (Group Hopped) | M_sc = 12 (v = 0) | PRB Index 1 |
3. Time-Domain OCC Spreading & Multiplexing Architecture
Physical resource mapping illustrating interleaved DM-RS/UCI symbols and Orthogonal Cover Code (w_i) vector spreading across hops.
* Relative Symbol Index:    [ 0 ]   [ 1 ]   [ 2 ]   [ 3 ]   [ 4 ]   [ 5 ]
* Resource Allocation:    | Pilot  | Data  | Pilot  | Data | Pilot  | Data  |
*                                                     (0)
*
* Subcarriers
*  ^
*  |  [Column 1]        [Column 3]        [Column 5]        [Column 7]
*  | +------------+   +------------+   +------------+   +------------+
   | |            |   |            |   |            |   |            |
   | | d(0)*w[0]*R|   | d(0)*w[1]*R|   | d(0)*w[2]*R|   | d(0)*w[3]*R|
   | |            |   |            |   |            |   |            |
   | +------------+   +------------+   +------------+   +------------+
   +--------------------------------------------------------------------> Time (Symbols)
                       (Note: Columns 0, 2, 4, 6 are the interleaved DM-RS pilots)


 Relative Index:      0          1          2      :      3          4          5          6
                  +----------+----------+----------+  : +----------+----------+----------+----------+
Physical Grid:    |  PILOT   |   DATA   |  PILOT   | : |  PILOT   |   DATA   |  PILOT   |   DATA   |
                  +----------+----------+----------+  : +----------+----------+----------+----------+
                   \______________________________/   :  \________________________________________/
                          HOP 1 (3 Symbols)           :               HOP 2 (4 Symbols)
                            (startingPRB)             :                (secondHopPRB)
                                                      :
Data OCC Vector:   w_i[0]        -        w_i[1]      :   w_i[0]        -        w_i[1]        -
Data SF (Length):  [====== Length = 2 ======]         :   [====== Length = 2 ======]
                                                      :
Pilot OCC Vector:    -         w_n[0]       -         :     -         w_n[0]       -         w_n[1]
Pilot SF (Length):             [= 1 =]                :               [====== Length = 2 ======]
3. Python Signal Analytics & Visualizations
Time-domain envelope and Power Spectral Density (PSD) plots exported from the Python test analytics pipeline.
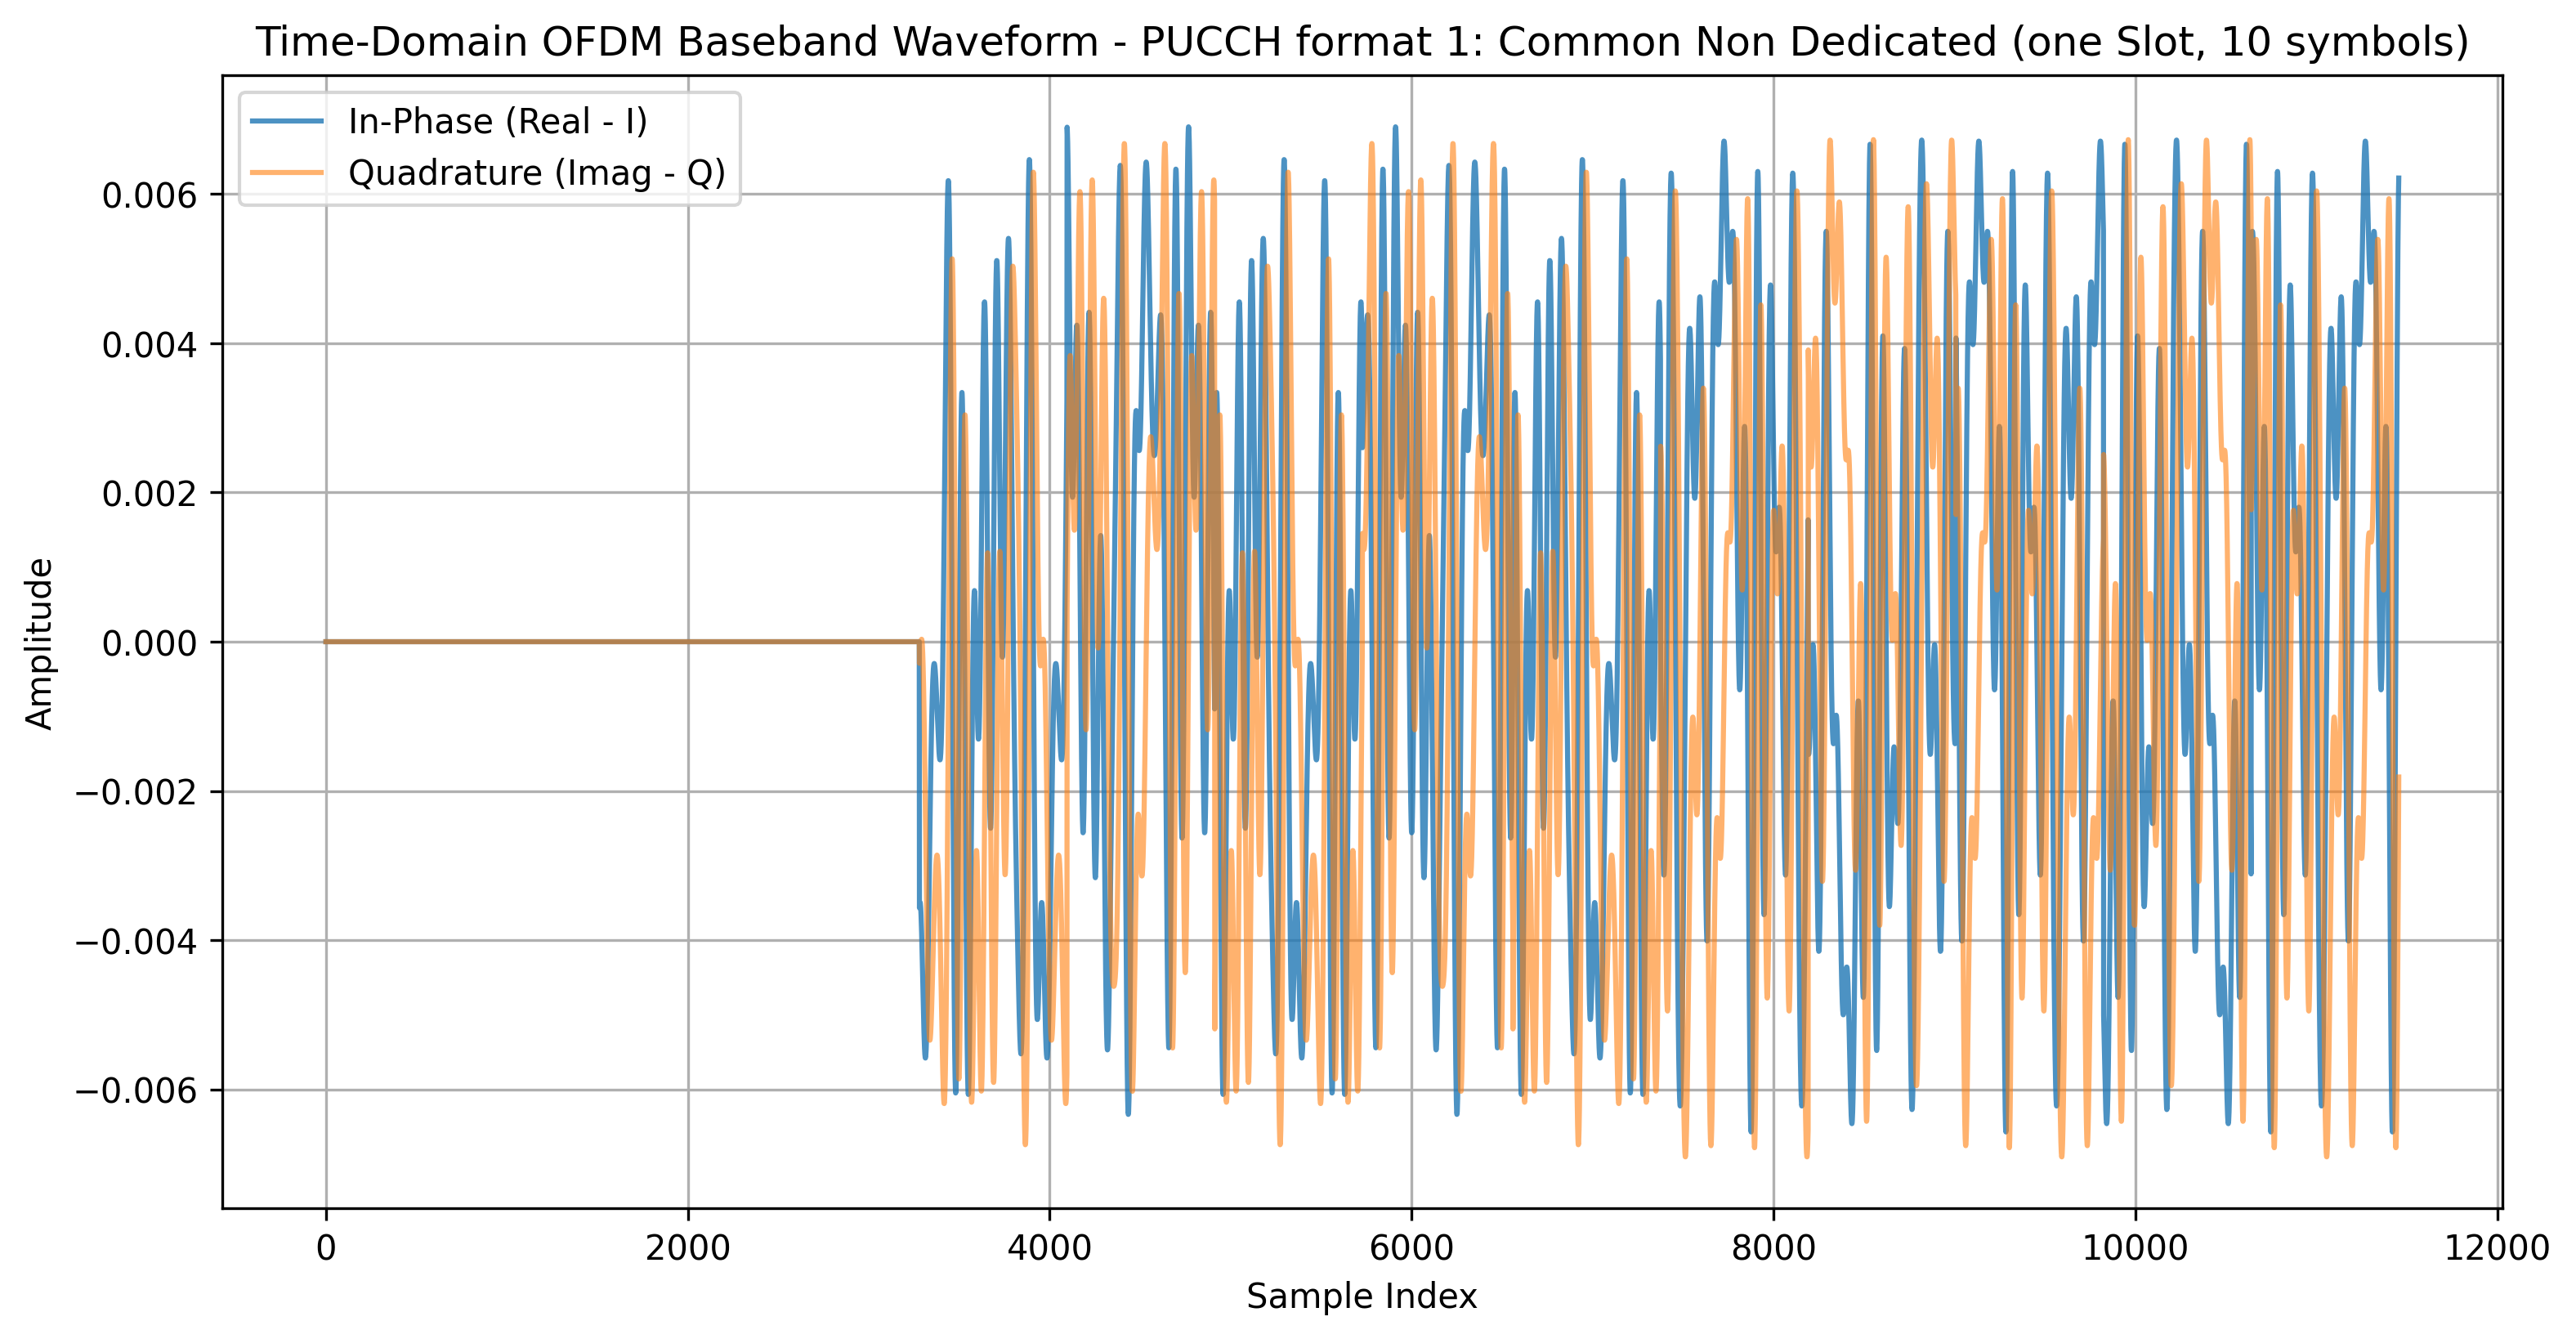
Figure 1: Time Domain Waveform
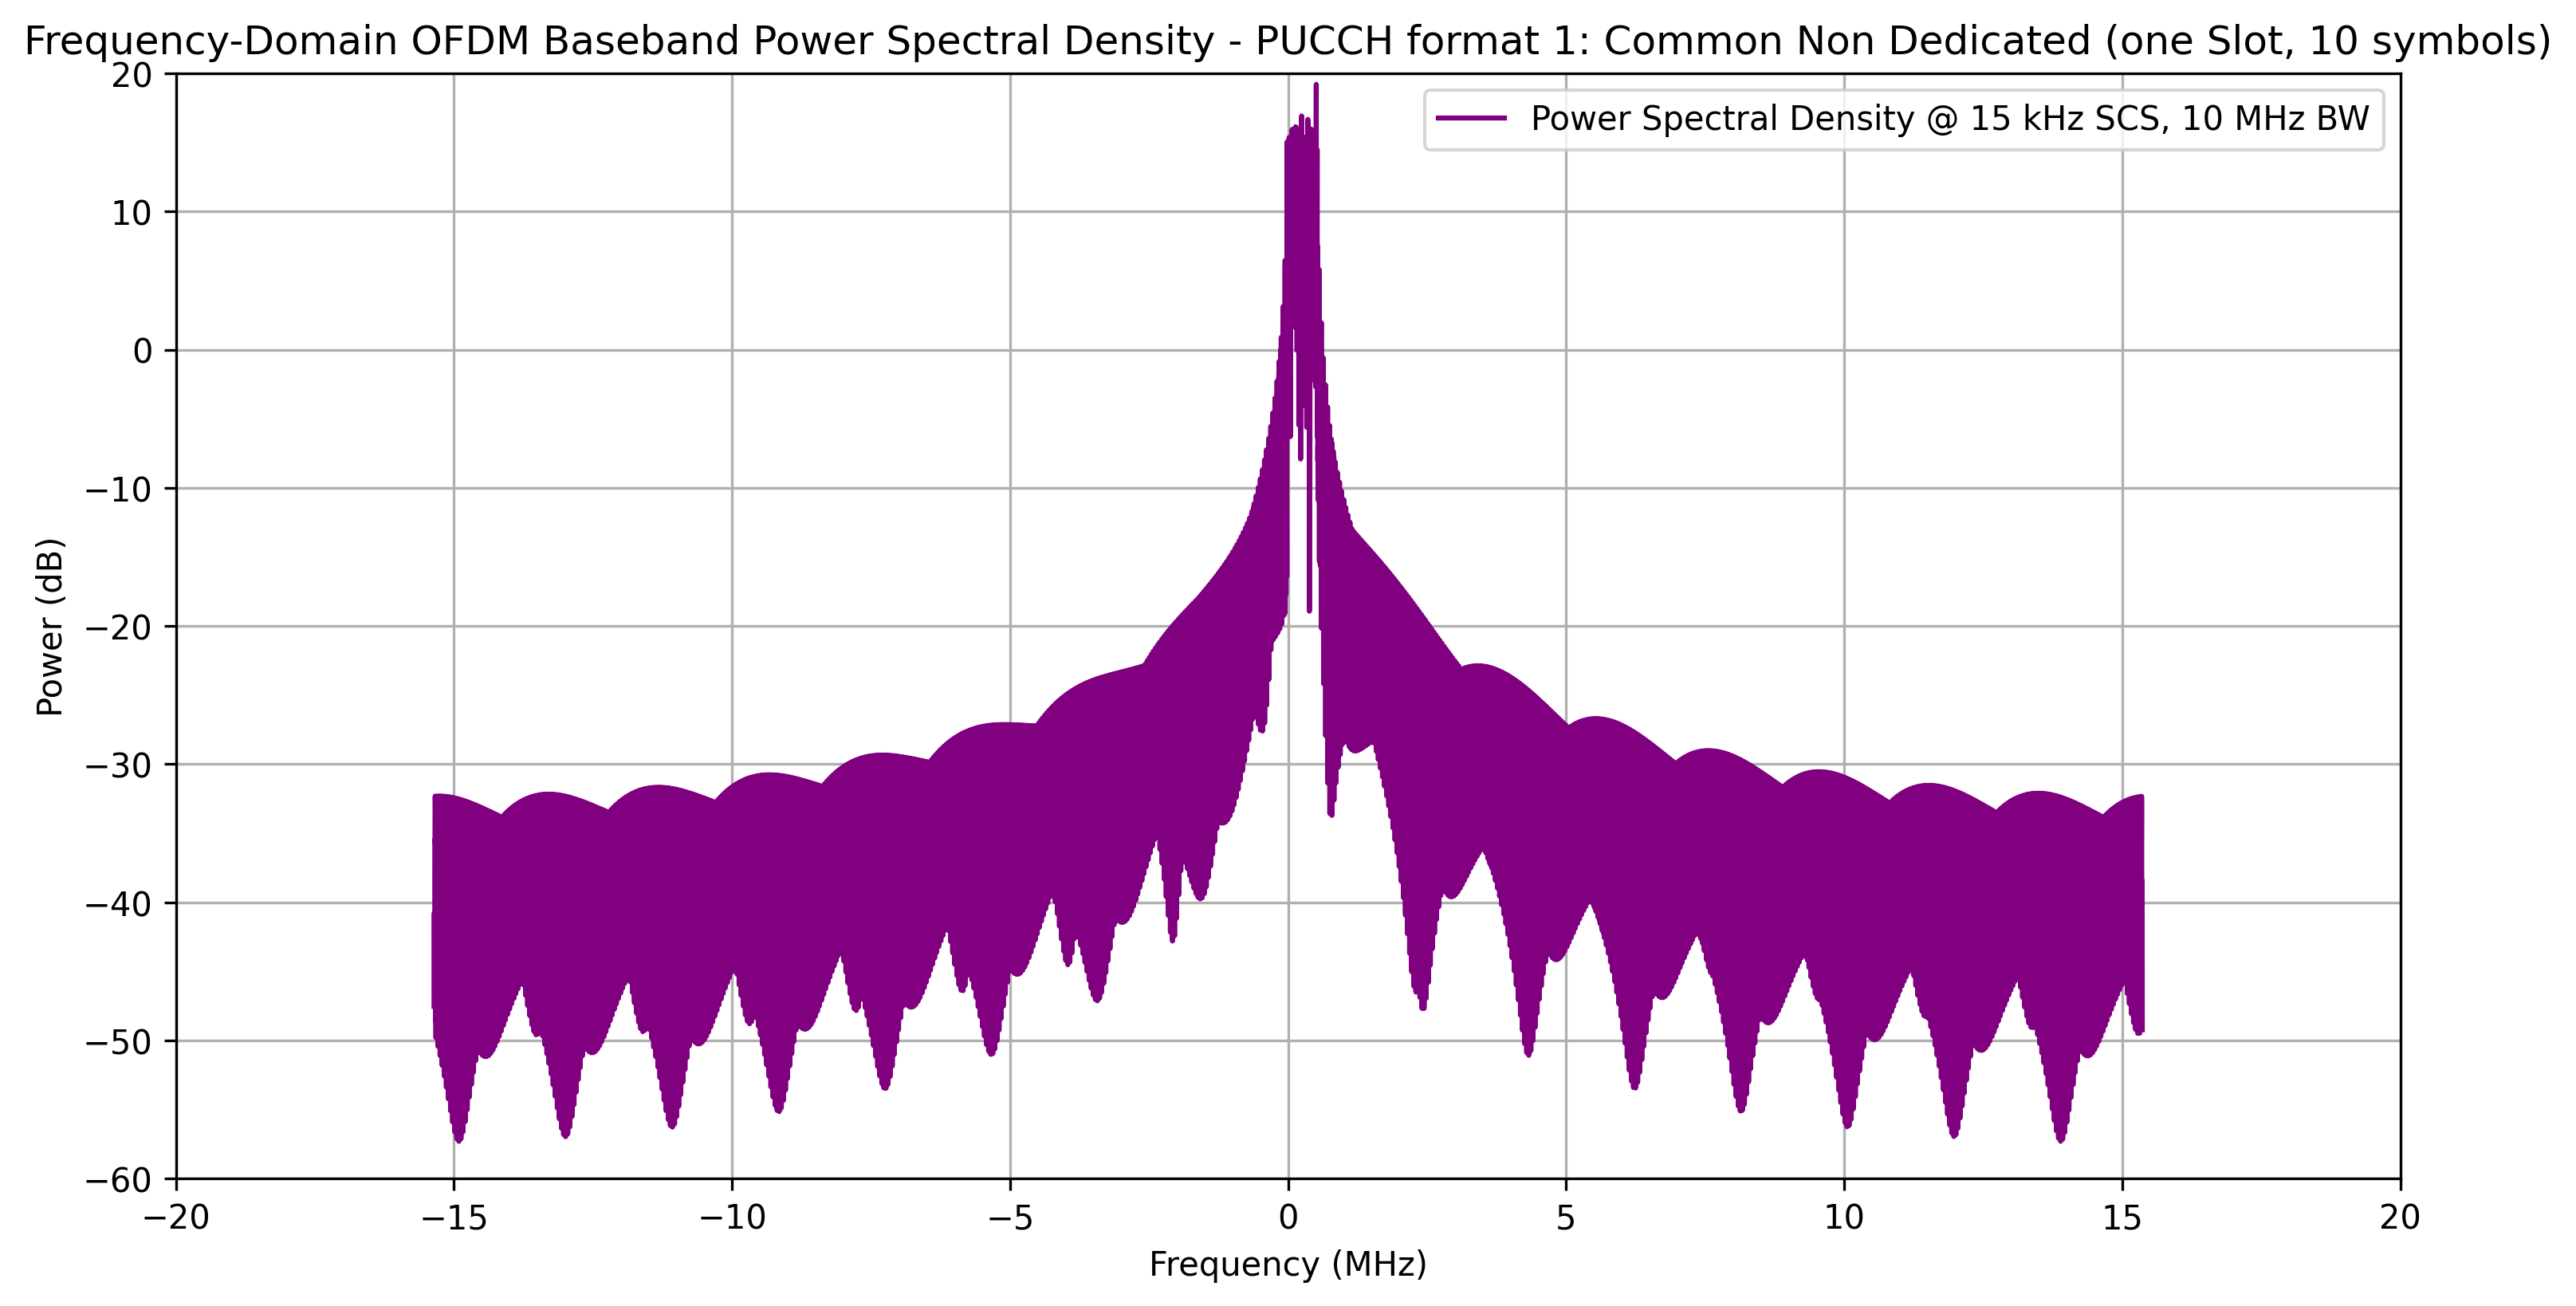
Figure 2: Power Spectral Density (PSD)